Documenting aquaculture activities
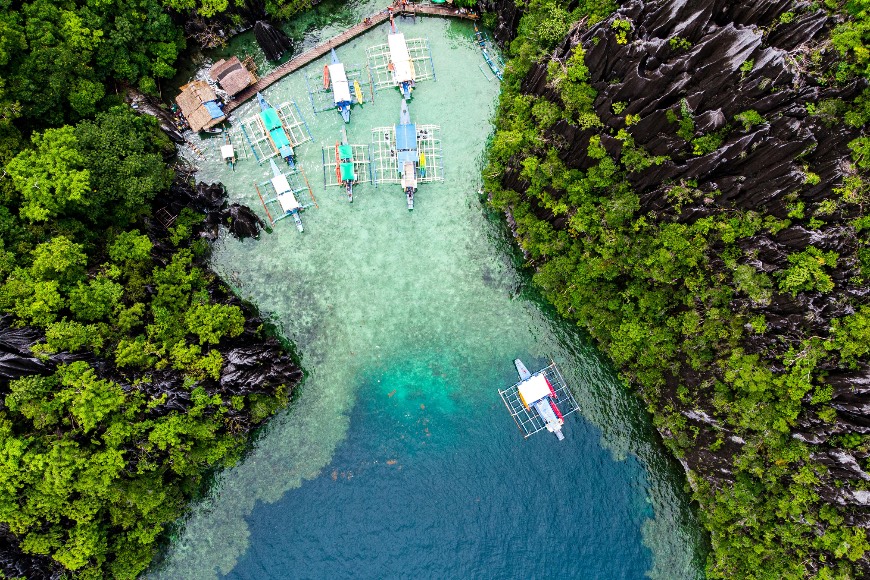
Palawan, in the Philippines, is a biodiverse coastal region in Southeast Asia, home to Puerto Princesa city, known as the "Eco-Tourism Center of the Philippines". It has been recognised as the cleanest and greenest city in the Philippines and supporting sustainable use of ocean resources is one of the key priorities for the local government. Local communities depend significantly on small-scale aquaculture, for both food security and livelihoods. Yet, these structures, particularly fish cages and fish corrals, are frequently constructed informally, without centralised records. This lack of documentation poses challenges for local authorities in managing marine resources, planning sustainable development, and monitoring environmental impacts. In addition, issues such as illegal fishing, destructive farming practices, and climate change-related disruptions to marine life threaten the long-term sustainability of aquaculture in the region.
This Use Case aims to generate Earth Observation-based, up-to-date maps of aquaculture structures using satellite data. These maps provide essential insights for local cooperatives, government agencies, and NGOs, enabling them to assess how the coastal space is used, and understand the interplay between aquaculture, fisheries, conservation, and tourism.Balancing the needs of the aquaculture industry with the preservation of Palawan’s natural environment and its growing tourism sector is a challenging task. The early adopters identified for this case study (EO4SA) are the Bureau of Fisheries and Aquatic Resources (BFAR) -Province and MIMAROPA Region, Philippines; and Palawan Aqua-Agri Venture Agriculture Cooperative (PAAVACO), Puerto Princesa City.
Use of EO
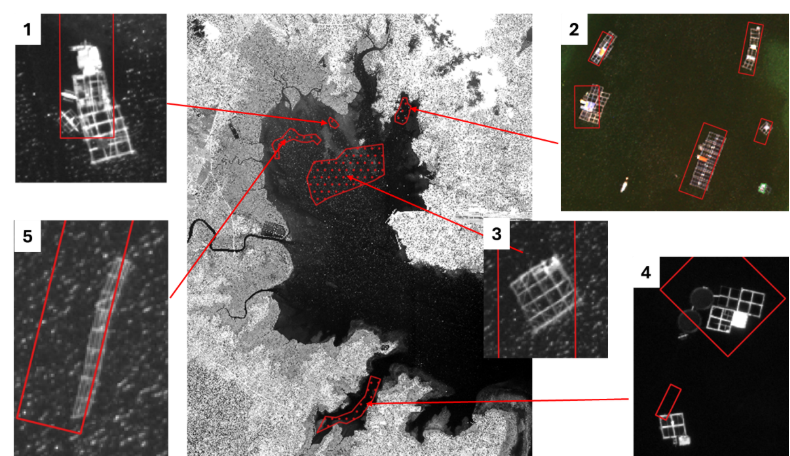
Earth observation (EO) provides a cost-effective and automated way to map aquaculture infrastructure over large areas. It can be used to regularly monitor aquaculture structures, although it requires automated processing of large volumes of data. The main challenges include the detection of very small objects, ranging in size from 5 to 25 metres; the range of materials that the aquaculture objects are made of, such as bamboo, polyethylene composites, plastic, and rope; plus the consideration of relatively low object density. Aquaculture in the study region is currently at an early developmental stage, and fish cages are sparsely distributed.
Aquaculture mapping can use both multispectral optical and synthetic aperture radar (SAR) data. For this Use Case, time series from Sentinel-1 SAR (A and C) and Sentinel-2 MSI (A and B) are used. SAR is particularly useful because it can collect images day and night and through cloud cover, making it more reliable in tropical and subtropical regions. High spatial resolution is important for detecting small cages, with the highest resolution being available from Sentinel-1 Single Look Complex (SLC) data. For Sentinel-2 MSI, the highest resolution is provided by the 10 m bands: B2, B3, B4, and B8.
Because the number of aquaculture cages in the study areas is relatively small, machine learning methods that require large training datasets are difficult to apply. Instead, this study uses a method developed by PML (Kurekin, 2022), which requires fewer training examples and can detect cages of different sizes.An extension of this method to Sentinel-2 MSI data was conducted to assess the feasibility for aquaculture mapping in the Philippines.
The Use Case covers three sites in the Philippines: Puerto Princesa City, Honda Bay, and Ulugan Bay, using Keyhole Markup Language format (KML) eXtensible Markup Language (XML) Comma-Separated Values (CSV). The mapping process is fully automated. It uses historical time series of Sentinel-1 SAR and Sentinel-2 MSI multispectral images, combined over time to distinguish stationary aquaculture structures from moving objects.The project has achieved an improvement in detecting small aquaculture objects, about 5 meters in diameter, by using the Sentinel-1 SAR Single Look Complex (SLC) product.
The Products
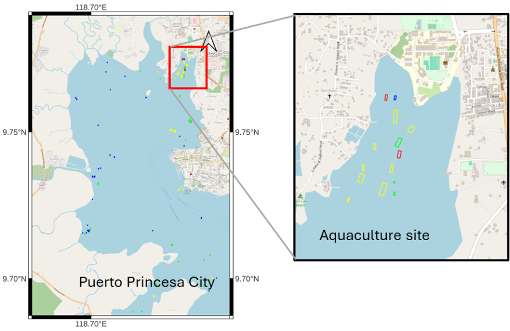
Aquaculture maps are made available as time series in four months intervals. The detected objects are displayed on the map as rectangles in different colours. The position and size of each rectangle correspond to the estimated real-world location and size of an aquaculture structure, such as a fish cage or caretaker shed.
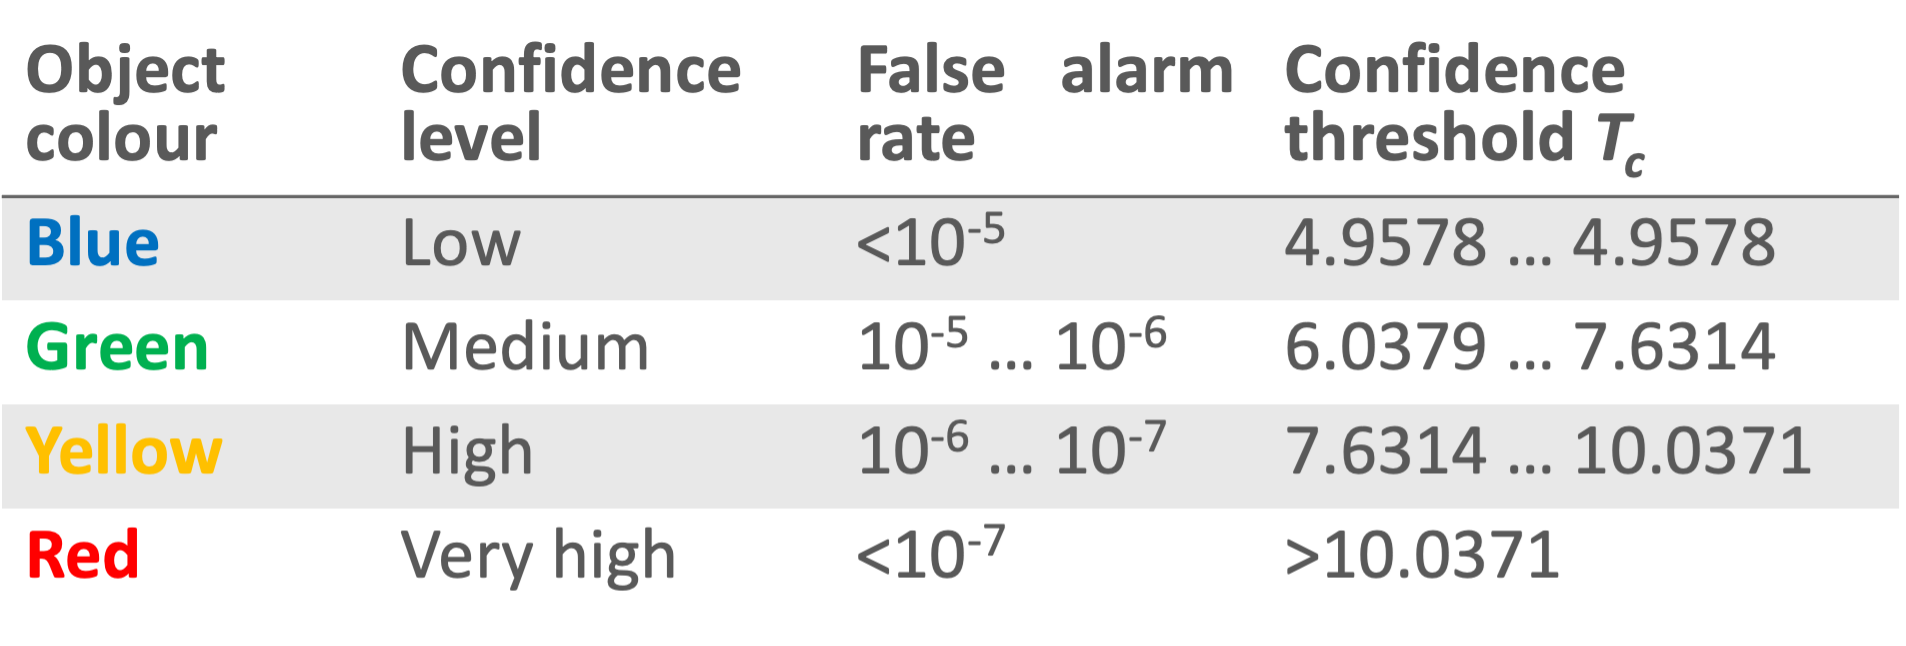
For each rectangular object additional information is provided, including latitude, longitude and detection confidence level. Confidence levels are represented using four colours listed in the table: blue (low confidence), green (medium confidence), yellow (high confidence), red (very high confidence).
The products are most accurate at detecting larger structures, such as caretaker sheds. It is more challenging to detect the smaller objects, like narrow cage structures and corrals, so the products must be viewed with caution. In addition, in Puerto Princesa City small boats anchored at the harbour can be incorrectly classified as static objects.
The maps are distributed directly to the Early Adopters using three file formats: Keyhole Markup Language format (KML) used with Google Earth; Comma-Separated Values (CSV) file format and Extensible Markup Language (XML) file format. Additionally, the maps are made publicly available online using Google Maps Service.
Accessing the maps online
Puerto Princesa City
Honda Bay
Ulugan Bay
Each link takes you to a web page displaying a map of the relevant area.